Practice drawing raster maps
library(tidyverse)
library(ggmap)
library(RColorBrewer)
library(here)

options(digits = 3)
set.seed(1234)
theme_set(theme_minimal())
Chicago 311 data
The city of Chicago has an excellent data portal publishing a large volume of public records. Here we’ll look at a subset of the 311 service requests. I used RSocrata and the data portal’s API to retrieve a portion of the data set.
If you are copying-and-pasting code from this demonstration, use
chi_311 <- read_csv("https://info5940.infosci.cornell.edu/data/chi-311.csv") to download the file from the course website.glimpse(chi_311)
## Rows: 261,869
## Columns: 8
## $ sr_number      <chr> "SR19-01209373", "SR19-01129184", "SR19-01130159", "SR1…
## $ sr_type        <chr> "Dead Animal Pick-Up Request", "Dead Animal Pick-Up Req…
## $ sr_short_code  <chr> "SGQ", "SGQ", "SGQ", "SGQ", "SGQ", "SGQ", "SGQ", "SGQ",…
## $ created_date   <dttm> 2019-03-23 12:13:05, 2019-03-08 19:37:26, 2019-03-09 0…
## $ community_area <dbl> 58, 40, 40, 67, 59, 59, 2, 59, 59, 64, 59, 25, 25, 59, …
## $ ward           <dbl> 12, 20, 20, 17, 12, 12, 40, 12, 12, 13, 12, 29, 28, 12,…
## $ latitude       <dbl> 41.8, 41.8, 41.8, 41.8, 41.8, 41.8, 42.0, 41.8, 41.8, 4…
## $ longitude      <dbl> -87.7, -87.6, -87.6, -87.7, -87.7, -87.7, -87.7, -87.7,…
Exercise: Visualize the 311 data
Obtain map tiles using
ggmapfor the city of Chicago.Click for the solution
# store bounding box coordinates
chi_bb <- c(
  left = -87.936287,
  bottom = 41.679835,
  right = -87.447052,
  top = 42.000835
)

# retrieve bounding box
chicago <- get_stamenmap(
  bbox = chi_bb,
  zoom = 11
)

# plot the raster map
ggmap(chicago)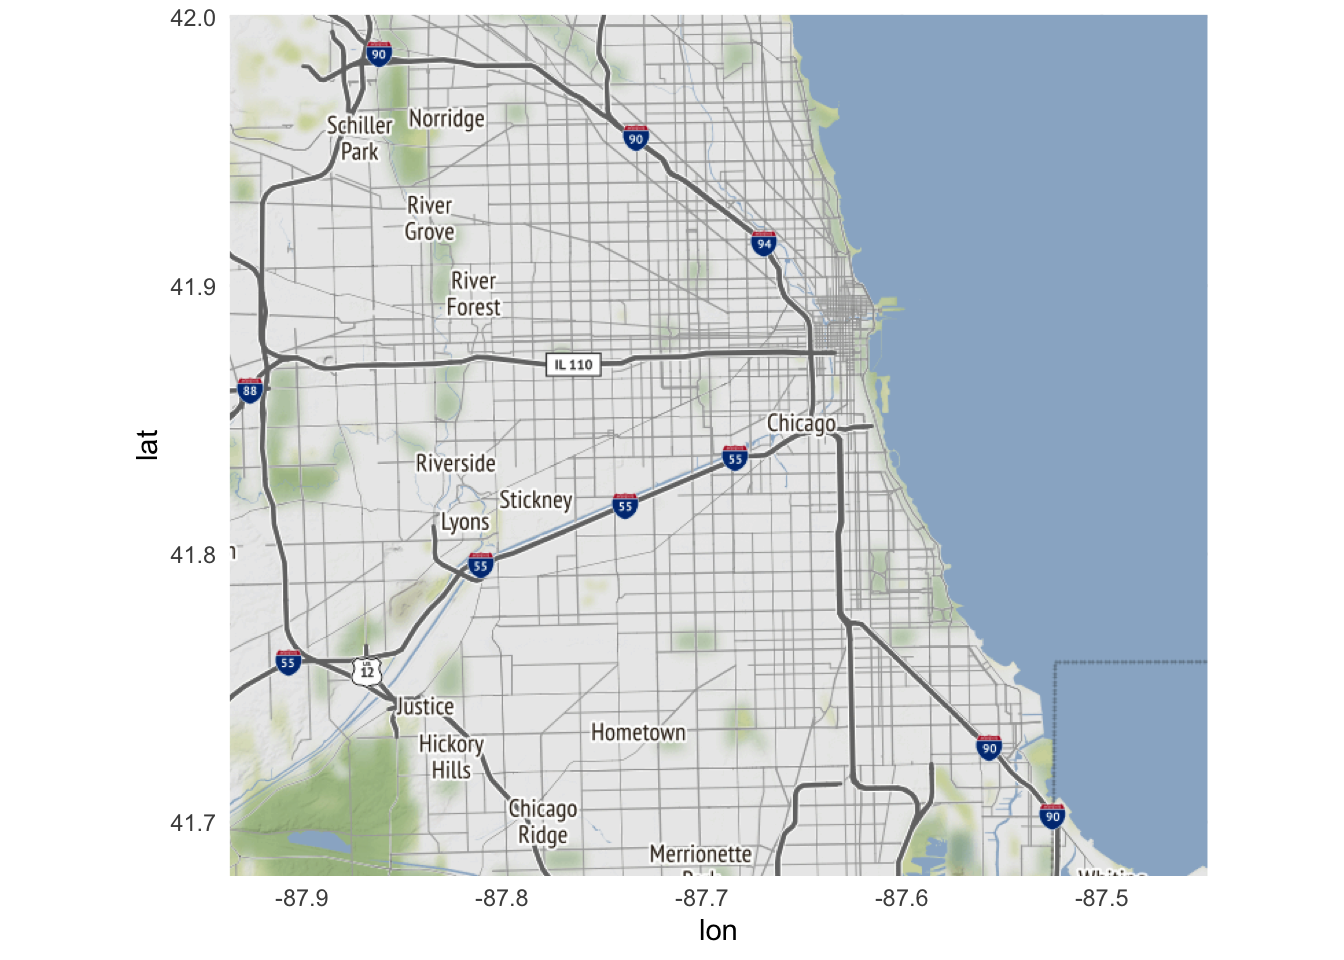
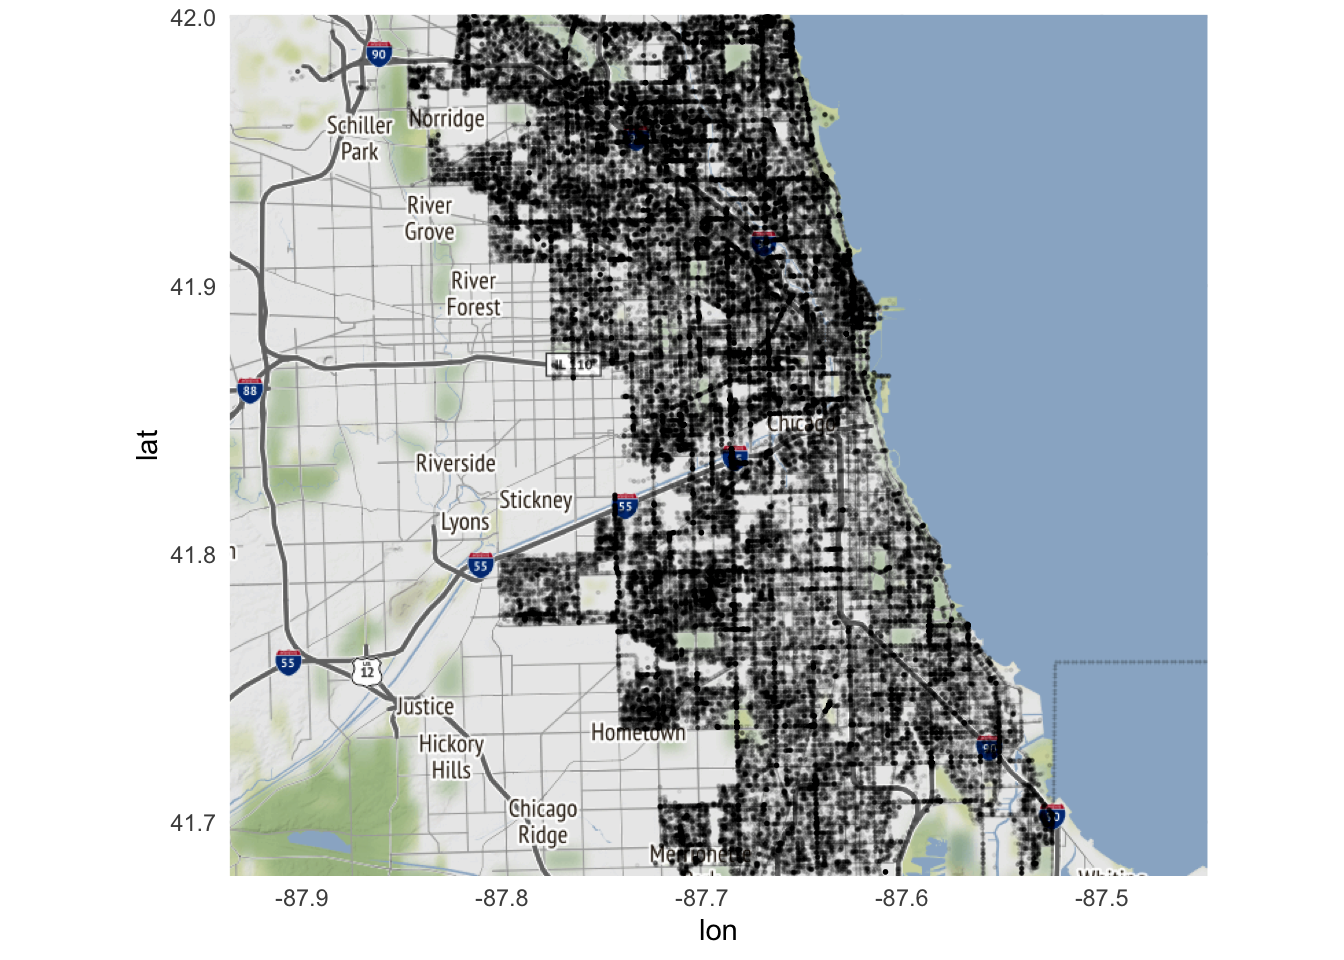
Generate a scatterplot of complaints about potholes in streets.
Click for the solution
# initialize map
ggmap(chicago) +
  # add layer with scatterplot
  # use alpha to show density of points
  geom_point(
    data = filter(chi_311, sr_type == "Pothole in Street Complaint"),
    mapping = aes(
      x = longitude,
      y = latitude
    ),
    size = .25,
    alpha = .05
  )
Generate a heatmap of complaints about potholes in streets. Do you see any unusual patterns or clusterings?
Click for the solution
# initialize the map
ggmap(chicago) +
  # add the heatmap
  stat_density_2d(
    data = filter(chi_311, sr_type == "Pothole in Street Complaint"),
    mapping = aes(
      x = longitude,
      y = latitude,
      fill = stat(level)
    ),
    alpha = .1,
    bins = 50,
    geom = "polygon"
  ) +
  # customize the color gradient
  scale_fill_gradientn(colors = brewer.pal(9, "YlOrRd"))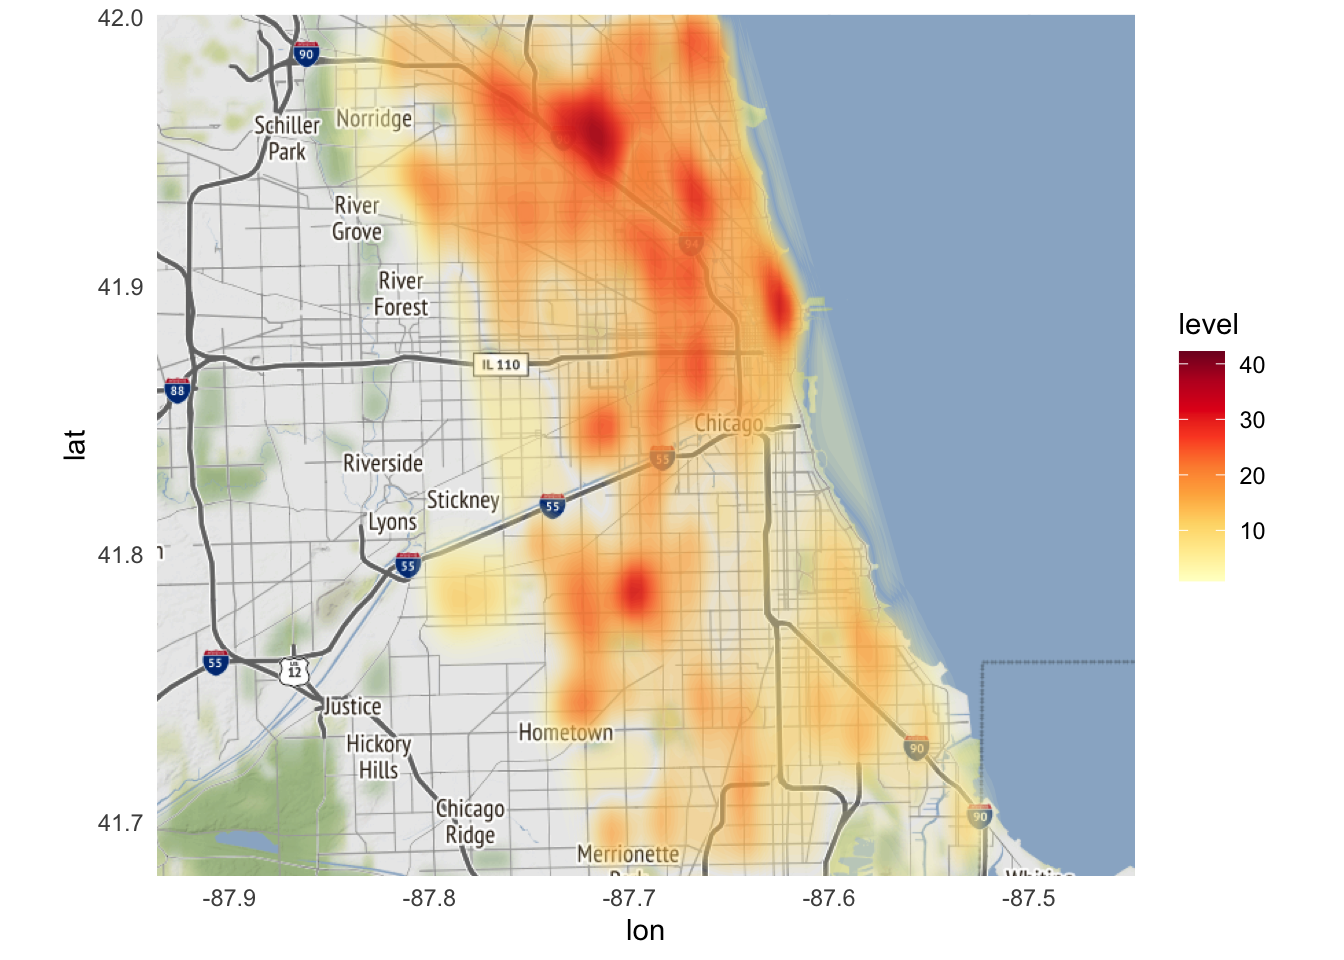
Seems to be clustered on the north side. Also looks to occur along major arterial routes for commuting traffic. Makes sense because they receive the most wear and tear.Obtain map tiles for Hyde Park.
Click for the solution
# store bounding box coordinates
hp_bb <- c(
  left = -87.608221,
  bottom = 41.783249,
  right = -87.577643,
  top = 41.803038
)

# retrieve bounding box
hyde_park <- get_stamenmap(
  bbox = hp_bb,
  zoom = 15
)

# plot the raster map
ggmap(hyde_park)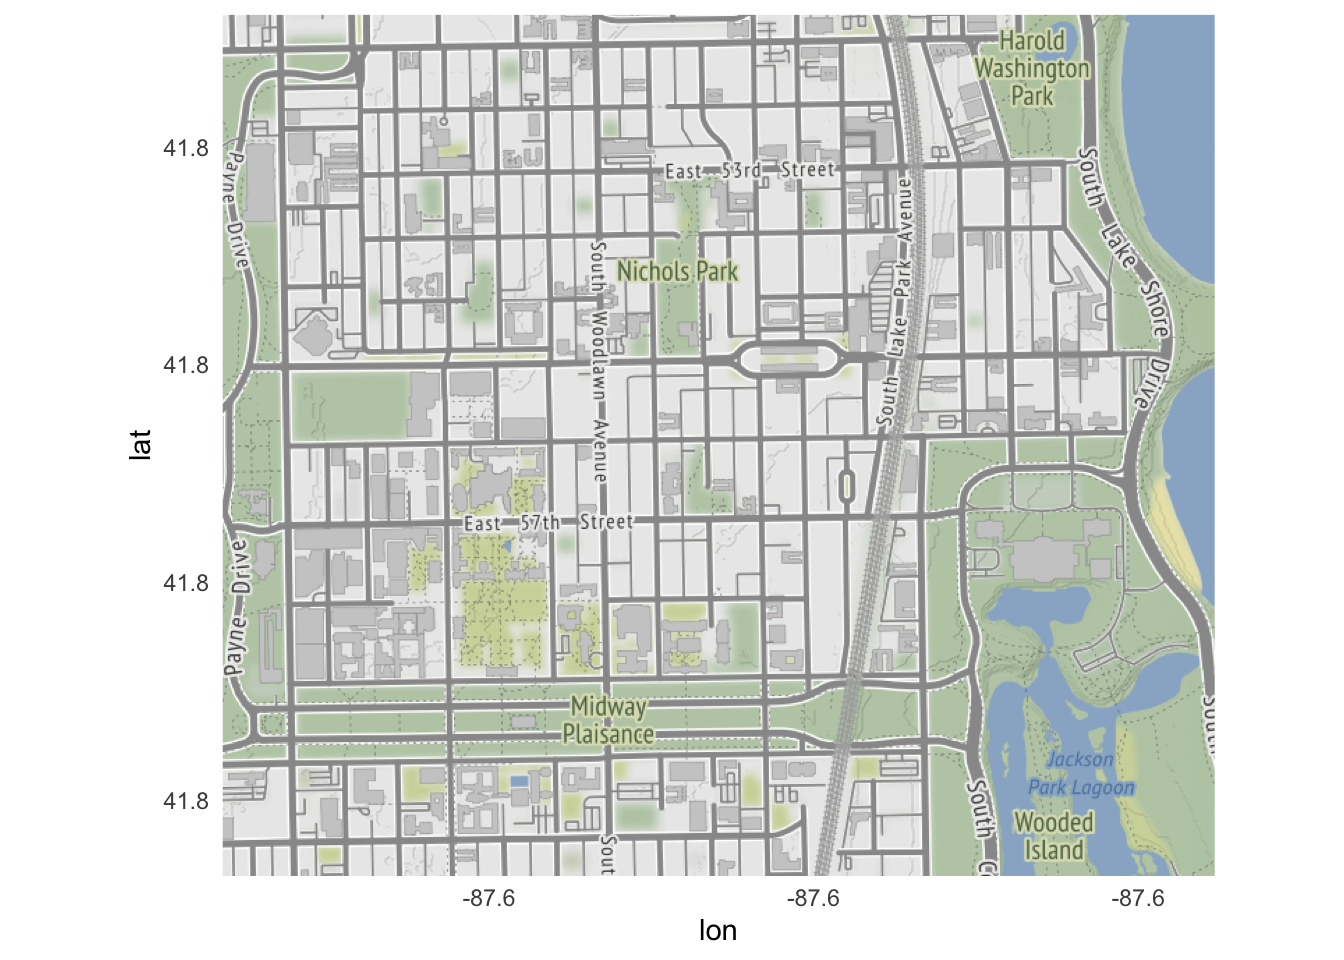
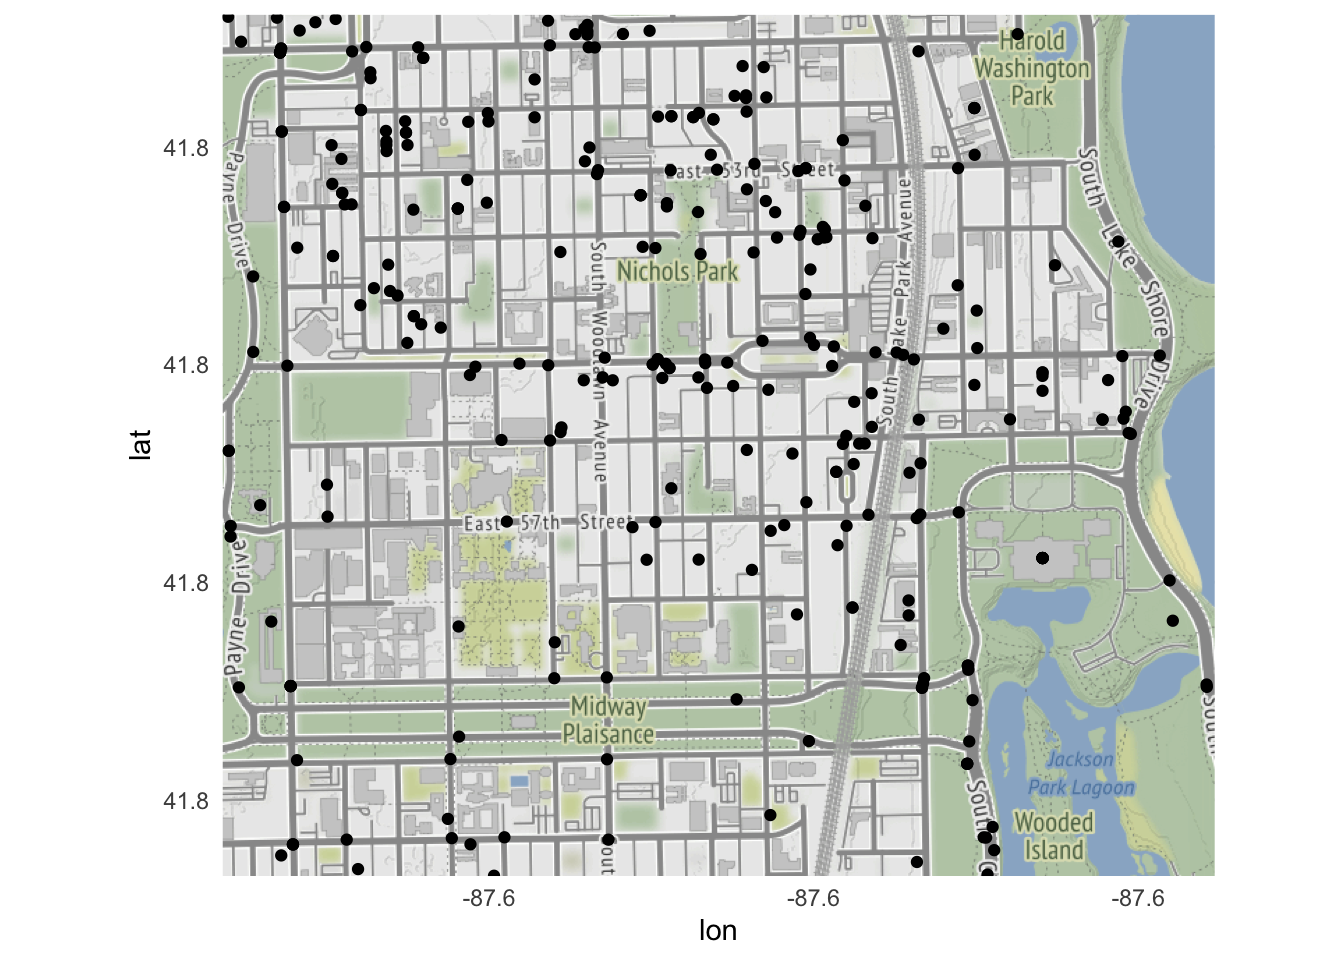
Generate a scatterplot of requests to pick up dead animals in Hyde Park.
Click for the solution
# initialize the map
ggmap(hyde_park) +
  # add a scatterplot layer
  geom_point(
    data = filter(chi_311, sr_type == "Dead Animal Pick-Up Request"),
    mapping = aes(
      x = longitude,
      y = latitude
    )
  )
Session Info
sessioninfo::session_info()
## ─ Session info ───────────────────────────────────────────────────────────────
##  setting  value
##  version  R version 4.2.1 (2022-06-23)
##  os       macOS Monterey 12.3
##  system   aarch64, darwin20
##  ui       X11
##  language (EN)
##  collate  en_US.UTF-8
##  ctype    en_US.UTF-8
##  tz       America/New_York
##  date     2022-08-11
##  pandoc   2.18 @ /Applications/RStudio.app/Contents/MacOS/quarto/bin/tools/ (via rmarkdown)
##
## ─ Packages ───────────────────────────────────────────────────────────────────
##  package       * version    date (UTC) lib source
##  assertthat      0.2.1      2019-03-21 [2] CRAN (R 4.2.0)
##  backports       1.4.1      2021-12-13 [2] CRAN (R 4.2.0)
##  bitops          1.0-7      2021-04-24 [2] CRAN (R 4.2.0)
##  blogdown        1.10       2022-05-10 [2] CRAN (R 4.2.0)
##  bookdown        0.27       2022-06-14 [2] CRAN (R 4.2.0)
##  broom           1.0.0      2022-07-01 [2] CRAN (R 4.2.0)
##  bslib           0.4.0      2022-07-16 [2] CRAN (R 4.2.0)
##  cachem          1.0.6      2021-08-19 [2] CRAN (R 4.2.0)
##  cellranger      1.1.0      2016-07-27 [2] CRAN (R 4.2.0)
##  cli             3.3.0      2022-04-25 [2] CRAN (R 4.2.0)
##  colorspace      2.0-3      2022-02-21 [2] CRAN (R 4.2.0)
##  crayon          1.5.1      2022-03-26 [2] CRAN (R 4.2.0)
##  DBI             1.1.3      2022-06-18 [2] CRAN (R 4.2.0)
##  dbplyr          2.2.1      2022-06-27 [2] CRAN (R 4.2.0)
##  digest          0.6.29     2021-12-01 [2] CRAN (R 4.2.0)
##  dplyr         * 1.0.9      2022-04-28 [2] CRAN (R 4.2.0)
##  ellipsis        0.3.2      2021-04-29 [2] CRAN (R 4.2.0)
##  evaluate        0.16       2022-08-09 [1] CRAN (R 4.2.1)
##  fansi           1.0.3      2022-03-24 [2] CRAN (R 4.2.0)
##  fastmap         1.1.0      2021-01-25 [2] CRAN (R 4.2.0)
##  forcats       * 0.5.1      2021-01-27 [2] CRAN (R 4.2.0)
##  fs              1.5.2      2021-12-08 [2] CRAN (R 4.2.0)
##  gargle          1.2.0      2021-07-02 [2] CRAN (R 4.2.0)
##  generics        0.1.3      2022-07-05 [2] CRAN (R 4.2.0)
##  ggmap         * 3.0.0      2019-02-05 [2] CRAN (R 4.2.0)
##  ggplot2       * 3.3.6      2022-05-03 [2] CRAN (R 4.2.0)
##  glue            1.6.2      2022-02-24 [2] CRAN (R 4.2.0)
##  googledrive     2.0.0      2021-07-08 [2] CRAN (R 4.2.0)
##  googlesheets4   1.0.0      2021-07-21 [2] CRAN (R 4.2.0)
##  gtable          0.3.0      2019-03-25 [2] CRAN (R 4.2.0)
##  haven           2.5.0      2022-04-15 [2] CRAN (R 4.2.0)
##  here          * 1.0.1      2020-12-13 [2] CRAN (R 4.2.0)
##  hms             1.1.1      2021-09-26 [2] CRAN (R 4.2.0)
##  htmltools       0.5.3      2022-07-18 [2] CRAN (R 4.2.0)
##  httr            1.4.3      2022-05-04 [2] CRAN (R 4.2.0)
##  jpeg            0.1-9      2021-07-24 [2] CRAN (R 4.2.0)
##  jquerylib       0.1.4      2021-04-26 [2] CRAN (R 4.2.0)
##  jsonlite        1.8.0      2022-02-22 [2] CRAN (R 4.2.0)
##  knitr           1.39       2022-04-26 [2] CRAN (R 4.2.0)
##  lattice         0.20-45    2021-09-22 [2] CRAN (R 4.2.1)
##  lifecycle       1.0.1      2021-09-24 [2] CRAN (R 4.2.0)
##  lubridate       1.8.0      2021-10-07 [2] CRAN (R 4.2.0)
##  magrittr        2.0.3      2022-03-30 [2] CRAN (R 4.2.0)
##  modelr          0.1.8      2020-05-19 [2] CRAN (R 4.2.0)
##  munsell         0.5.0      2018-06-12 [2] CRAN (R 4.2.0)
##  pillar          1.8.0      2022-07-18 [2] CRAN (R 4.2.0)
##  pkgconfig       2.0.3      2019-09-22 [2] CRAN (R 4.2.0)
##  plyr            1.8.7      2022-03-24 [2] CRAN (R 4.2.0)
##  png             0.1-7      2013-12-03 [2] CRAN (R 4.2.0)
##  purrr         * 0.3.4      2020-04-17 [2] CRAN (R 4.2.0)
##  R6              2.5.1      2021-08-19 [2] CRAN (R 4.2.0)
##  RColorBrewer  * 1.1-3      2022-04-03 [2] CRAN (R 4.2.0)
##  Rcpp            1.0.9      2022-07-08 [2] CRAN (R 4.2.0)
##  readr         * 2.1.2      2022-01-30 [2] CRAN (R 4.2.0)
##  readxl          1.4.0      2022-03-28 [2] CRAN (R 4.2.0)
##  reprex          2.0.1.9000 2022-08-10 [1] Github (tidyverse/reprex@6d3ad07)
##  RgoogleMaps     1.4.5.3    2020-02-12 [2] CRAN (R 4.2.0)
##  rjson           0.2.21     2022-01-09 [2] CRAN (R 4.2.0)
##  rlang           1.0.4      2022-07-12 [2] CRAN (R 4.2.0)
##  rmarkdown       2.14       2022-04-25 [2] CRAN (R 4.2.0)
##  rprojroot       2.0.3      2022-04-02 [2] CRAN (R 4.2.0)
##  rstudioapi      0.13       2020-11-12 [2] CRAN (R 4.2.0)
##  rvest           1.0.2      2021-10-16 [2] CRAN (R 4.2.0)
##  sass            0.4.2      2022-07-16 [2] CRAN (R 4.2.0)
##  scales          1.2.0      2022-04-13 [2] CRAN (R 4.2.0)
##  sessioninfo     1.2.2      2021-12-06 [2] CRAN (R 4.2.0)
##  sp              1.5-0      2022-06-05 [2] CRAN (R 4.2.0)
##  stringi         1.7.8      2022-07-11 [2] CRAN (R 4.2.0)
##  stringr       * 1.4.0      2019-02-10 [2] CRAN (R 4.2.0)
##  tibble        * 3.1.8      2022-07-22 [2] CRAN (R 4.2.0)
##  tidyr         * 1.2.0      2022-02-01 [2] CRAN (R 4.2.0)
##  tidyselect      1.1.2      2022-02-21 [2] CRAN (R 4.2.0)
##  tidyverse     * 1.3.2      2022-07-18 [2] CRAN (R 4.2.0)
##  tzdb            0.3.0      2022-03-28 [2] CRAN (R 4.2.0)
##  utf8            1.2.2      2021-07-24 [2] CRAN (R 4.2.0)
##  vctrs           0.4.1      2022-04-13 [2] CRAN (R 4.2.0)
##  withr           2.5.0      2022-03-03 [2] CRAN (R 4.2.0)
##  xfun            0.31       2022-05-10 [1] CRAN (R 4.2.0)
##  xml2            1.3.3      2021-11-30 [2] CRAN (R 4.2.0)
##  yaml            2.3.5      2022-02-21 [2] CRAN (R 4.2.0)
##
##  [1] /Users/soltoffbc/Library/R/arm64/4.2/library
##  [2] /Library/Frameworks/R.framework/Versions/4.2-arm64/Resources/library
##
## ──────────────────────────────────────────────────────────────────────────────